Climate in-brief

  • The latest multi-week model survey shows NSW as the main beneficiary for July rainfall, with other Qld and tropical areas likely to be average, or drier than normal.

  • A review of seasonal model prediction in March for the season ahead shows temperature predictions were reasonably accurate. Rainfall forecasts were limited in their usefulness during the period.

  • Stored soil moisture continues to reach capacity in many east-coast catchments after recent rainfall as any future falls increasingly likely to run water into dams and rivers.

The chart above shows a large area of high pressure circulating moisture anti-clockwise into the Australian region. A hint of the atmosphere coupling with a wet Indian Ocean Dipole in that region worth pointing out.

The chart above shows a large area of high pressure circulating moisture anti-clockwise into the Australian region. A hint of the atmosphere coupling with a wet Indian Ocean Dipole in that region worth pointing out.

Australian daily and weekly rainfall observations

Some handy falls in the channel country and inland NSW. Overnight figures not updated yet. Go to the link below this afternoon for new numbers:tp://www.bom.gov.au/australia/flood/?ref=ftr

Some handy falls in the channel country and inland NSW. Overnight figures not updated yet. Go to the link below this afternoon for new numbers:

tp://www.bom.gov.au/australia/flood/?ref=ftr

Weekly rain saw moisture finally arrive through western Qld and continued falls in NSW MDB and ranges.Australian 7-day rainfall map courtesy http://www.bom.gov.au/climate/maps/rainfall/?variable=rainfall&map=totals&period=week&region=nat&year=2020&month=12&day=17

Weekly rain saw moisture finally arrive through western Qld and continued falls in NSW MDB and ranges.

Australian 7-day rainfall map courtesy http://www.bom.gov.au/climate/maps/rainfall/?variable=rainfall&map=totals&period=week&region=nat&year=2020&month=12&day=17

Multi-week planner (8-28 days)

The Tropical Hazards map shows the passing MJO to Australias north generating rainfall across the Maritime Continent, with no influence on tropical mainland Australia during the next fortnight. Apart from warmer SSTs, it’s difficult once again to see supporting fundamentals for the BOMs extremely bullish wet July forecast (bottom chart), as the SAM also retreats towards neutral. NSW look to be the most likely area to receive wetter than normal falls this month. Check your median totals for July, as northern regions favour this category. With the exception of the NT and Ord, temperatures will likely remain normal also.

Multiweek models.jpg

Model commentary: A quick look at the bookmaker's selections from a fortnight ago shows the US colt, NCEP first past the winning post with pre-race tactics and sticking to the rails over the distance paying dividends. The JMA also showed similar national pride with a stellar gallop on a wet track, true to form. The media hype around the ACCESS-S gelding showed glimpses of form with punters now a little more confident in the mount after recent surgery. Normally solid performing US mare IRI was more cautious before the race and sat mid-field throughout and failed to fire in the straight.

Go to 10-day Forecast XL for a full summary of all ‘weather models’ as rain events draw closer for your area: https://meteologix.com/au

BOM.jpg

Monitoring the SAM

The SAM has been strongly positive through June, pushing moisture into eastern Australian productive agricultural areas. The guidance below expects the SAM to retreat back into neutral levels, so it looks unlikely to influence our climate in the next fortnight at least.

Now we are in winter its time to start monitoring the SAM again. When the SAM is negative, winds from Antarctica blow further north up into southern Australia. When the SAM is positive, these winds pull back towards Antarctica, allowing moisture from the tropics to push into Qld and NSW. The SAMs main influence is in spring and summer, but it is worth keeping an eye on to help us ground-truth model guidance when we see a change. A really good video at the bottom of this article will help explain this a little better.

Antarctic Oscillation or SAM values (2 July)

Recent research by Hendon et al, (2014) at the Centre for Australian Weather and Climate Research found the Southern Annular Mode to be the leading mode of circulation variability through parts of inland eastern Australia where cotton is grown; particularly in the spring planting period.
 
A positive SAM has been proven to increase moisture supply into fronts and troughs forming in eastern Australia. The chart provided by Climate Prediction Center (US) shows the most recent observations of the SAM or (AAO). 

A negative SAM traditionally leads to a dry westerly circulation pattern through eastern Australian cropping areas.
 
BOM researchers Lim and Hendon (2013) found the SAM has the strongest connection with El-Niño Southern Oscillation in October and November – whereby the SAM is influenced most by El Niño or La Niña conditions.

Growers and advisors are encouraged to monitor the phases of the SAM together with seasonal forecasting, multi-week and short term weather models during planting. A short cartoon explaining the SAM can be found HERE

Analysis: Apr-Jun season predictions v observations

A look back to mid-March 2021 at the seasonal forecast issued for Apr-Jun showed a wet signal very for the top end, based on the warm Arafura Sea and Ningaloo Region off the WA coast. The BOM model hosed down expectations with a neutral forecast for all other areas, which was pretty close. The IRI model was picking up activity in eastern NSW as was the European CS3 group of models, which did occur in a few pockets. None of the predictions picked up the broad-scale decile 2-3 rainfall across 50% of the continent, although temperatures were reasonably close to what was predicted. None of the models really nailed it through this period but this also highlights the difficulties when the climate drivers are finding their feet. The trophies stay in the cabinet again this month!

Apr-Jun rain (LHS) and temp (RHS) deciles

Apr-Jun rain (LHS) and temp (RHS) deciles

March forecast.jpg

Monitoring soil moisture this winter cropping season

A glance at the root zone moisture from the BOMs water balance model shows continued improvement through western Qld, although soil moisture in the WA region has worsened in the last fortnight. The Murray-Darling Basin looks primed for a flood, with all at capacity except the far north sitting on average.

Source: http://www.bom.gov.au/water/landscape/#/sm/Relative/day/-28.4/130.4/3/Point////2021/6/3/

Rootzone soil moisture 1 July

soil water.jpg

Monitoring the SOI and Darwin barometric pressure

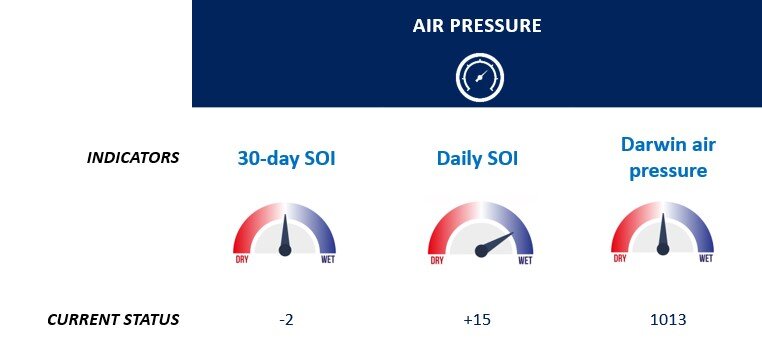
The SOI has been dragging the chain from the wet signal relating to warm SSTs. The SOI has been below zero recently. The daily values show a climbing trend which will lift the 30-day average. The barometric pressure at Darwin is still only average. The take-home message is that the atmosphere is not supporting the theory from some model guidance (just yet) we should be preparing for prolonged wet conditions.

The Southern Oscillation Index or SOI is a standardised index of the barometric pressures over Darwin, Australia and Tahiti. Climate scientists use the SOI to assess the strength of the El Niño Southern Oscillation phenomenon (or ENSO), which in Queensland and NSW accounts for nearly 25 per cent of our year-to-year rainfall variability. For example, it is often wetter during a La Niña classified year (when the sustained SOI is very positive (higher than +7)) and drier during an El Niño classified year (when the sustained SOI is very negative (lower than -7)). The index scale ranges from about +35 to -35 using the Troup method of calculation used on Long Paddock.

In a recent Farmer Forecast interview with Prof. Toshio Yamagata, he encouraged us to also consider the barometric pressure at Darwin, for above/below average as a more useful proxy for air pressure, moisture transport and rainfall potential in our region. The reason being as this value is more representative of current conditions in the eastern Indian Ocean. See news article here: https://www.graincentral.com/weather/japanese-climate-pioneer-retraces-indian-ocean-dipole-influence-on-australian-agriculture/

Prof. Yamagata and his team published a journal article on their research in this area:

Behera, Swadhin & Yamagata, Toshio. (2003). Influence of the Indian Ocean Dipole on the Southern Oscillation. Journal of The Meteorological Society of Japan - J METEOROL SOC JPN. 81. 10.2151/jmsj.81.169.

Air pressure indicators 25 June 2021

Farmer Forecast - Tool of the week

Wasting time with water and chemical logistics, trying to spray fallows and crops and battling high winds - or simply looking to fly a kite?

The BOMs wind modelling forecast can help plan ahead out to 7 days.

The outputs are broken into 6-hourly intervals. Click on the link below to plan your spray (or kite-flying!) week:

http://www.bom.gov.au/watl/wind/forecast.shtml

BOMs wind modelling forecast tool

10-day rainfall outlook

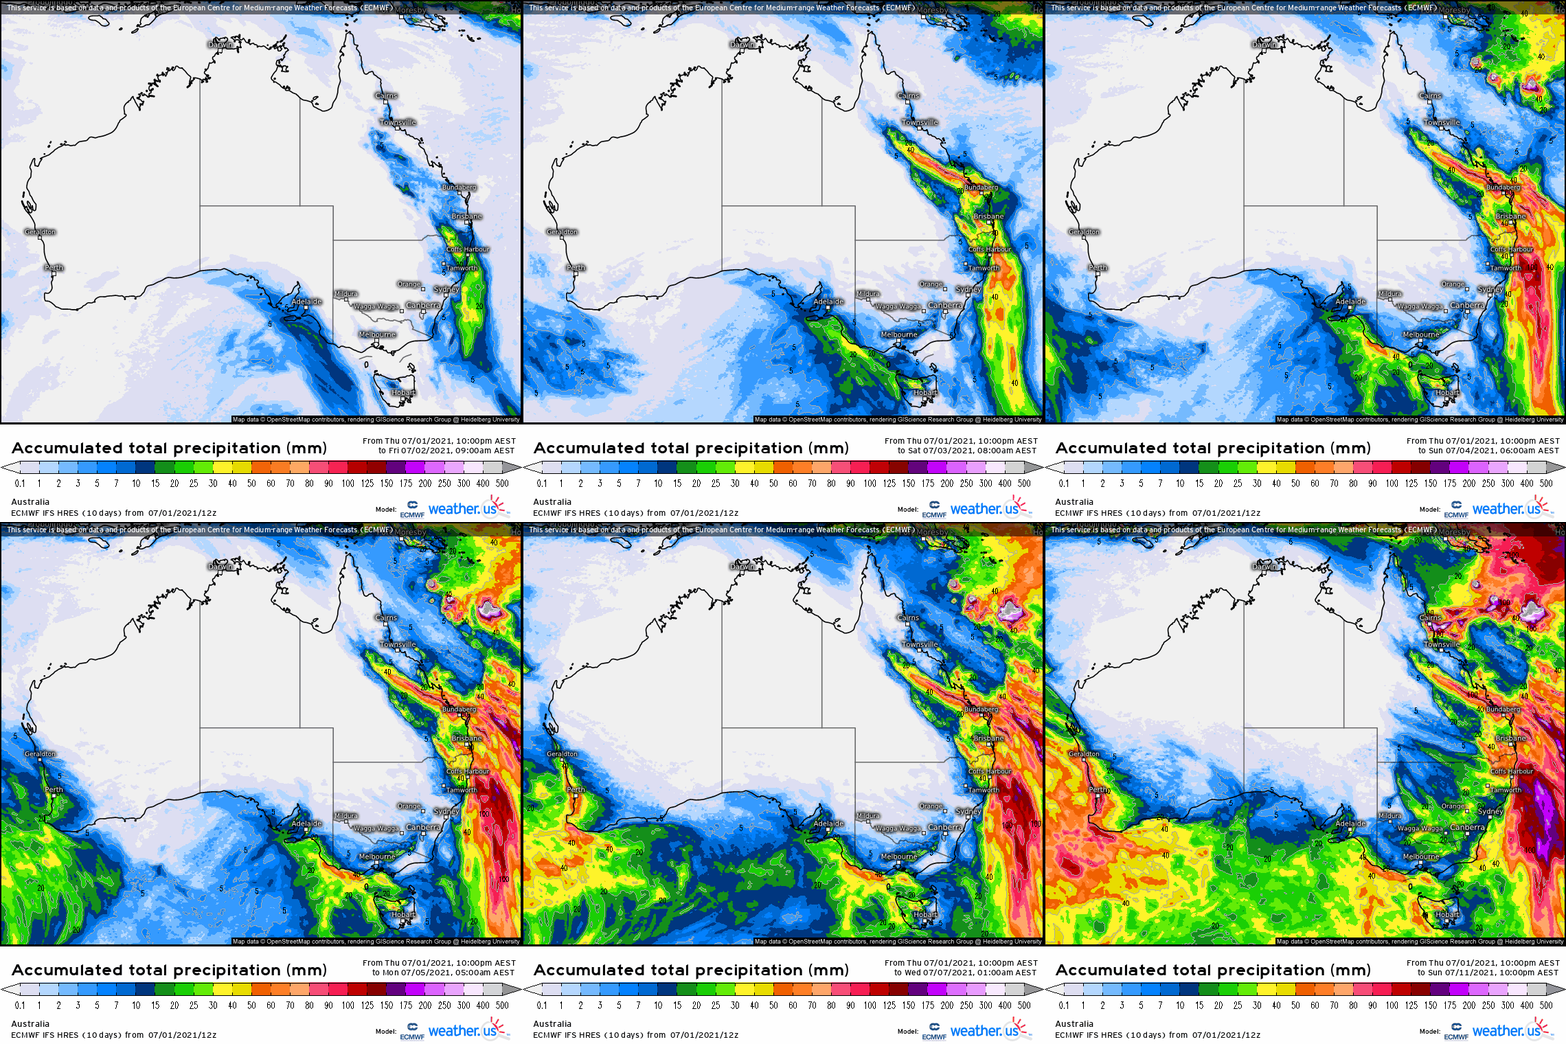
Today’s 10-day ECMWF model loop favours smaller rainfall totals in the eastern half of NSW and C Qld. A quick run around the grounds this morning and we still have a split jury on the BOMs emphatic forecast wet July. The JMA and IRI refreshed outputs have a neutral-dry-ish theme for the next 10-28 days, with some light falls for NSW. More detail in next Fridays fortnightly climate wrap-up.

Keep an eye on https://meteologix.com/au for more site-specific analysis.

Image loop courtesy Meteologix

Image loop courtesy Meteologix


Climate in-brief

  • The latest seasonal model survey for Jul-Aug-Sep shows consensus for a wetter than normal period ahead. The outlook also indicates normal temperatures, with the exception of warmer temps in the tropics.

  • The multi-week assessment shows more rain in the forecast, however moderate totals seem more likely in NSW and eastern Qld areas.

  • A crystal ball glance at spring conditions reveals the IRI North American ensemble favouring wet conditions through central and eastern Australia. Farmers and business owners are encouraged to prepare scenarios for this outcome occurring.

The chart above shows a mass of low air pressure over Australia during a wet week for SE areas of the continent.

The chart above shows a mass of low air pressure over Australia during a wet week for SE areas of the continent.

Australian daily and weekly rainfall observations

Eastern Qld finally catching up on totals with handy falls in the last 24 hrs, along with those along the Great Dividing Range further south.tp://www.bom.gov.au/australia/flood/?ref=ftr

Eastern Qld finally catching up on totals with handy falls in the last 24 hrs, along with those along the Great Dividing Range further south.

tp://www.bom.gov.au/australia/flood/?ref=ftr

Weekly rain has favoured the Murray-Darling Basin and the Eastern half of Qld. Australian 7-day rainfall map courtesy http://www.bom.gov.au/climate/maps/rainfall/?variable=rainfall&map=totals&period=week&region=nat&year=2020&month=12&day=17

Weekly rain has favoured the Murray-Darling Basin and the Eastern half of Qld.

Australian 7-day rainfall map courtesy http://www.bom.gov.au/climate/maps/rainfall/?variable=rainfall&map=totals&period=week&region=nat&year=2020&month=12&day=17

Multi-week planner (8-28 days)

De Ja Vu in some sense this fortnight - the anticipation of warmer waters around Australias perimeter and increased cloud cover has some models excited by the prospects for rain over the next 4 weeks. A few more fundamentals favouring wet this time around, coming from our oceans (Modoki & IOD), however, the SOI is still not responding, sitting at zero. The IRI model is still not interested in rainfall over the analysis period anywhere in Australia. NSW and CQ look to be the main areas of favour for the remaining 3 models assessed. Cooler conditions remain until mid-July through all areas, except the tropical north.

Multiweek models.jpg

Model commentary: Stewards from the channel country and CQ were seen grinning as stallion ACCESS-S came back from vet surgery 2 stone lighter, following erratic performances in recent weeks. However, even as a gelding, this equine continues to show exuberance out of the blocks and punters are still optimistic fortunes will change perhaps now and better form approaching. JMA has crept up on the rails and the mount seems to taking the whip with a long handle this campaign. NCEP is showing a burst of speed at certain intervals along the journey, but prefers NSW and eastern Qld tracks this month.

Go to 10-day Forecast XL for a full summary of all ‘weather models’ as rain events draw closer for your area: https://meteologix.com/au

2021 Jul-Aug-Sep seasonal outlook

A survey of 12 international models condensed in the below charts (top both and bottom LHS) shows the outlook for late winter early spring rain sitting in the upper level of probabilities. The BOMs ACCESS model is showing “Anthony Mundine” like confidence in its predictions for some eastern locations, whereas the group of European multi-model is more conservative. With more certainty on the path of key drivers: IOD and Modoki this month, those who have decisions to make in the spring should be running this very wet scenario in their businesses. No extreme temperatures predicted is a salient point, as we know heat can undo an erratic wet forecast coming into spring.

See the bottom chart for the IRIs refreshed early spring outlook!

Order of Figures clockwise from top left: ACCESS-S tercile forecast, CS3 multi-model tercile (ECMWF, UK, France, Italy, US, Japan), 5x North American models combined on the bottom showing rainfall (LHS) and temperature (RHS). IRIs extended outlook at the bottom.

IRIs winter precip and temp forecasts

IRIs winter precip and temp forecasts

IRI’s early spring forecast refreshed this week.

IRI’s early spring forecast refreshed this week.

Monitoring soil moisture this winter cropping season

A glance at the root zone moisture from the BOMs water balance model shows an improvement through eastern Qld and parched areas of SA and Vic. Central Australia is still waiting for the miraculous wet forecasts issued by ACCESS-S to come to fruition. When considering soil moisture in the nations key farming areas and a bullish seasonal outlook, one would have to anticipate commodity purchasers salivating on prospects of a record winter crop and cheaper prices.

Source: http://www.bom.gov.au/water/landscape/#/sm/Relative/day/-28.4/130.4/3/Point////2021/6/3/

Rootzone soil moisture 18 June

Root zone moisture.jpg

The big picture - 2021 Long-range driver update

  • The latest global model summary released by the BOM this week shows an improvement from a fortnight ago. Neutral/wet ENSO is favoured during the business end of the winter crop and spring pasture growing conditions - although it continues trending wetter as the year progresses (similar to 2020).

  • The Indian Ocean Dipole outlook is again erratic, but leaning towards wet phase. What the bar charts don’t show is the warm sea temps around Australia’s northwest coming through the models as increased chance of NW cloud bands for eastern Australia. (Go to our Farmer Forecast homepage to see the warm SSTs loop around Australia).

  • The ENSO Modoki is trending wet (black line, below). The JAMSTEC forecast numbers sent through by the scientist there shows Modoki wet phase peaking in Nov. The BOM prediction below shows a Sep peak for this driver.

  • Wet Modoki and warm ocean temps around Australia are flowing through model predictions as wetter than normal conditions, despite neutral IOD and ENSO (see bottom chart “what affects me, when?”).

The chart above shows neutral ENSO conditions likely, but trending towards a late La Nina againhttp://www.bom.gov.au/climate/enso/#tabs=Pacific-Ocean

The chart above shows neutral ENSO conditions likely, but trending towards a late La Nina again

http://www.bom.gov.au/climate/enso/#tabs=Pacific-Ocean

The BOM’s ACCESS-S model shows this indicator moving more into wet phase than a fortnight ago. A good thing for eastern Australia.

The BOM’s ACCESS-S model shows this indicator moving more into wet phase than a fortnight ago. A good thing for eastern Australia.

Indian Ocean Dipole outlook (8 June)

This looked settled a fortnight ago, but the passing MJO played havoc with SSTs in the Indian Ocean! All over the place again, but we have warm water outside this measuring zone - which is a good thing.Forecast chart courtesy:http://www.bom.gov.au/c…

This looked settled a fortnight ago, but the passing MJO played havoc with SSTs in the Indian Ocean! All over the place again, but we have warm water outside this measuring zone - which is a good thing.

Forecast chart courtesy:http://www.bom.gov.au/climate/enso/#tabs=Indian-Ocean

What affects me, when? A rolling 3 month moving window: See here, EMI = Modoki (navy), Nino3 = ENSO (green), IOD = Indian Ocean Dipole (red) and SAM = Southern Annular Mode (yellow). White - not significant!

From Lim et al (2012): https://www.cawcr.gov.au/technical-reports/CTR_051.pdf

Weather forecasting and primary producers - have your say

CRDC is part of the Managing Climate Variability (MCV) research program (MLA, GRDC, SRA & Agrifutures) - the lead R&D program in Australia for providing practical weather and climate information and tools to help growers manage the risks and capitalise on the opportunities resulting from changes in weather and climate.

The MCV team are inviting primary producers to participate in a survey to help them understand how weather and climate forecasting (weeks to months ahead) can best meet your needs and to ensure you have a voice at the table where other agriculture sectors are having their say.

The survey takes less than 10-12 minutes to complete.  To participate, please click here: https://Q21001.surveys.qmr.com.au/cgi-bin/ciwweb.pl?studyname=21001&fSample=2&subsid=2222. Please note: the survey ends on Wed 16 June.

MCV survey.jpg

10-day rainfall outlook

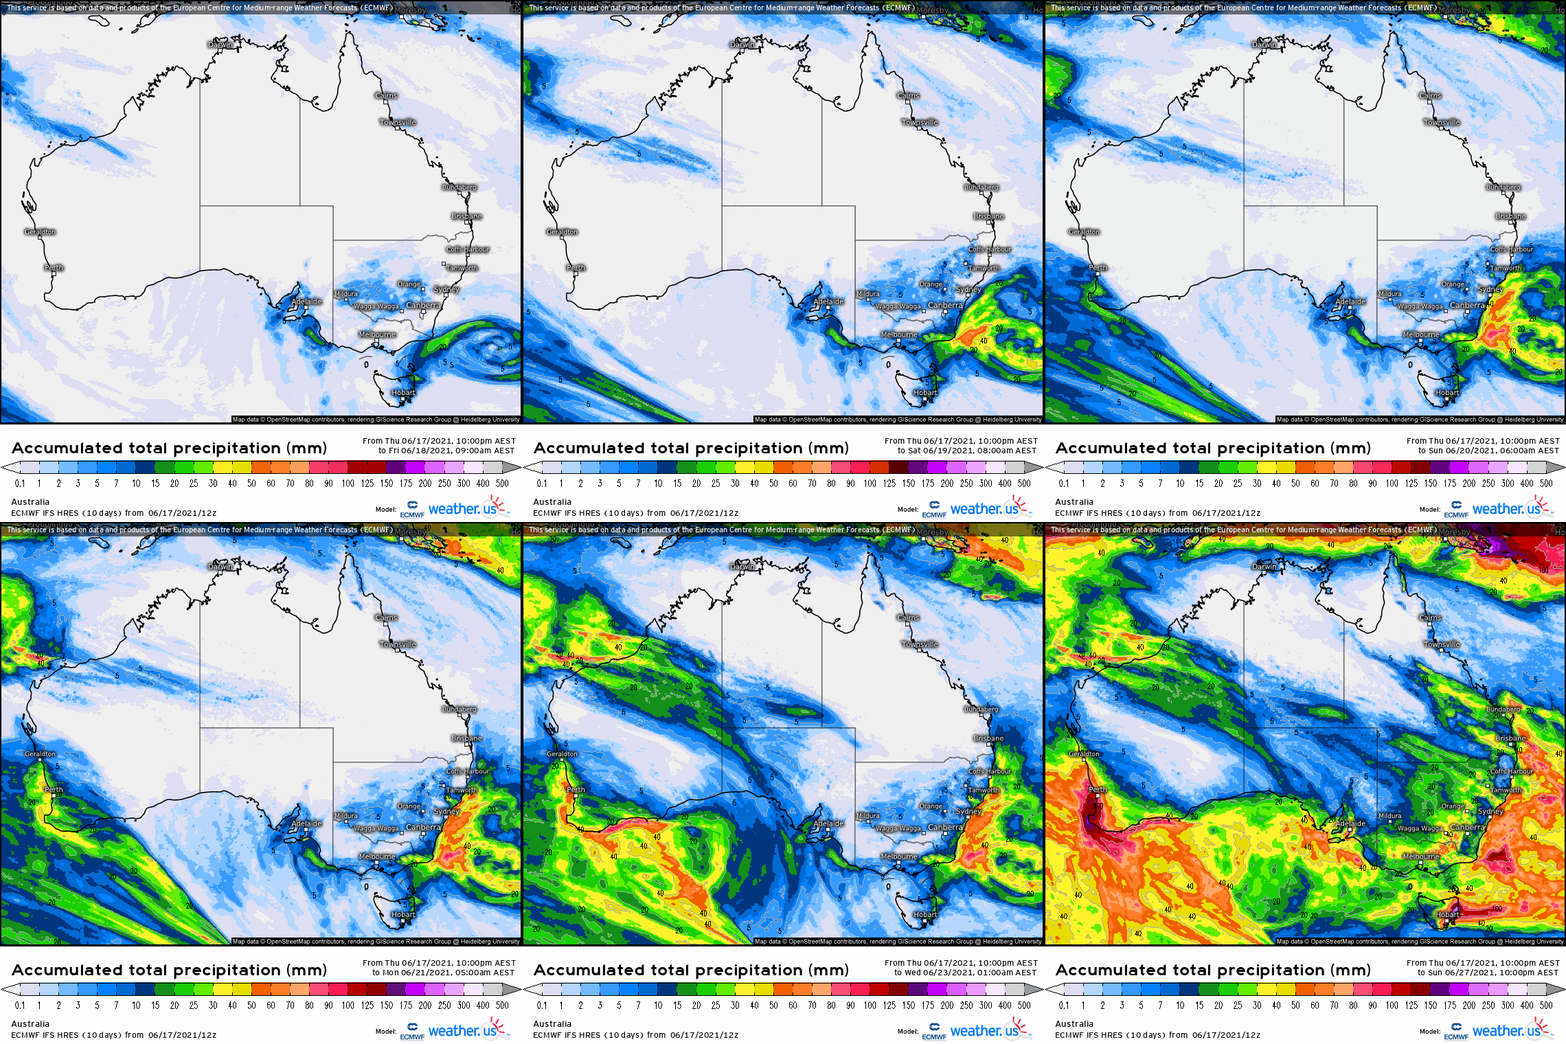
Today’s 10-day ECMWF model loop is favouring the eastern half of NSW and Qld as the main rainfall beneficiaries. A look at the refreshed JMA, BOM and IRI weekly predictions show a wide model spread, consistent with the last 6 weeks. The BOM is still very excited about serious wet conditions for large areas - off the back of warm oceans around Australia. Again, none of the other globals are interested in anything other than patchy rainfall events (leading to average monthly totals) in the coming weeks. Click through next Friday for a more detailed multi-week analysis.

Keep an eye on https://meteologix.com/au for more site-specific analysis.

Image loop courtesy Meteologix

Image loop courtesy Meteologix


Climate in-brief

  • Models divided on the June outlook following handy falls through NSW and eastern Qld in the last few days.

  • The remainder of June is shaping up as more in line with climatology (average rain/temp statistics) despite the BOMs access model showing an emphatic wet signal across large areas for the second fortnight in a row.

  • A look back on the international seasonal model guidance against Autumn precip and temp observations found accuracy with a general wet theme for Australia, however none of the models surveyed captured the conditions accurately across the forecast area.

The chart above shows the intense high pressure over Australia easing in the last 7-days with more normal air pressure. Encouraging to see low air pressure in the eastern Indian Ocean as the dipole commences its life cycle for 2021.

The chart above shows the intense high pressure over Australia easing in the last 7-days with more normal air pressure. Encouraging to see low air pressure in the eastern Indian Ocean as the dipole commences its life cycle for 2021.

Australian daily and weekly rainfall observations

Localised falls of ~50mm in the last 48 hrs through eastern parts. tp://www.bom.gov.au/australia/flood/?ref=ftr

Localised falls of ~50mm in the last 48 hrs through eastern parts. tp://www.bom.gov.au/australia/flood/?ref=ftr

Weekly rain has favoured the Murray-Darling Basin. Note the falls from the 24hrs (left) have not been included in this chart yet.Australian 7-day rainfall map courtesy http://www.bom.gov.au/climate/maps/rainfall/?variable=rainfall&map=totals&period=week&region=nat&year=2020&month=12&day=17

Weekly rain has favoured the Murray-Darling Basin. Note the falls from the 24hrs (left) have not been included in this chart yet.

Australian 7-day rainfall map courtesy http://www.bom.gov.au/climate/maps/rainfall/?variable=rainfall&map=totals&period=week&region=nat&year=2020&month=12&day=17