Josh McGregor - McGregor Gourlay, Moree
/
Josh McGregor
McGregor Gourlay Agricultural Sevices
Climate is a significant consideration for Josh McGregor in his role as Managing Director of McGregor Gourlay Agricultural Services. Based in Moree, Josh has been building his climate literacy so he can stay ahead of the weather, ensuring he can meet his clients cropping and livestock input needs. Interpreting complex scientific information has been a challenge Josh has been well and truly up for, following extreme drought, and more recently, flooding rains across his geographical area. Agribusinesses confront similar challenges to managing staff and inputs in the same way farmers do. Janine caught up with Josh recently to hear his climate story.

As a subscriber – what do you feel are the key benefits of Farmer Forecast to your business?
There’s so many different models available to look at these days, and you can easily find yourself getting lost in it all and unsure what to follow. So we find the Farmer Forecast newsletter is great for dissecting the data that is relevant for our part of the world and giving us the heads up to watch developments of which we would have otherwise been unaware. Every extra day that we can have up our sleeves to prepare for a rain event is a bonus.
Where else do you like to look for your climate & weather information?
I find WillyWeather is good for current info such as wind and precipitation, and YR is usually good to get an idea of the likely spread of forecast precipitation. But Meteologix has definitely become the best source for getting a cross section of all the major short term forecast models, and it’s the one that we’ll all watch for any developing event. Any further out than that we just wait for guidance from the Farmer Forecast newsletter.
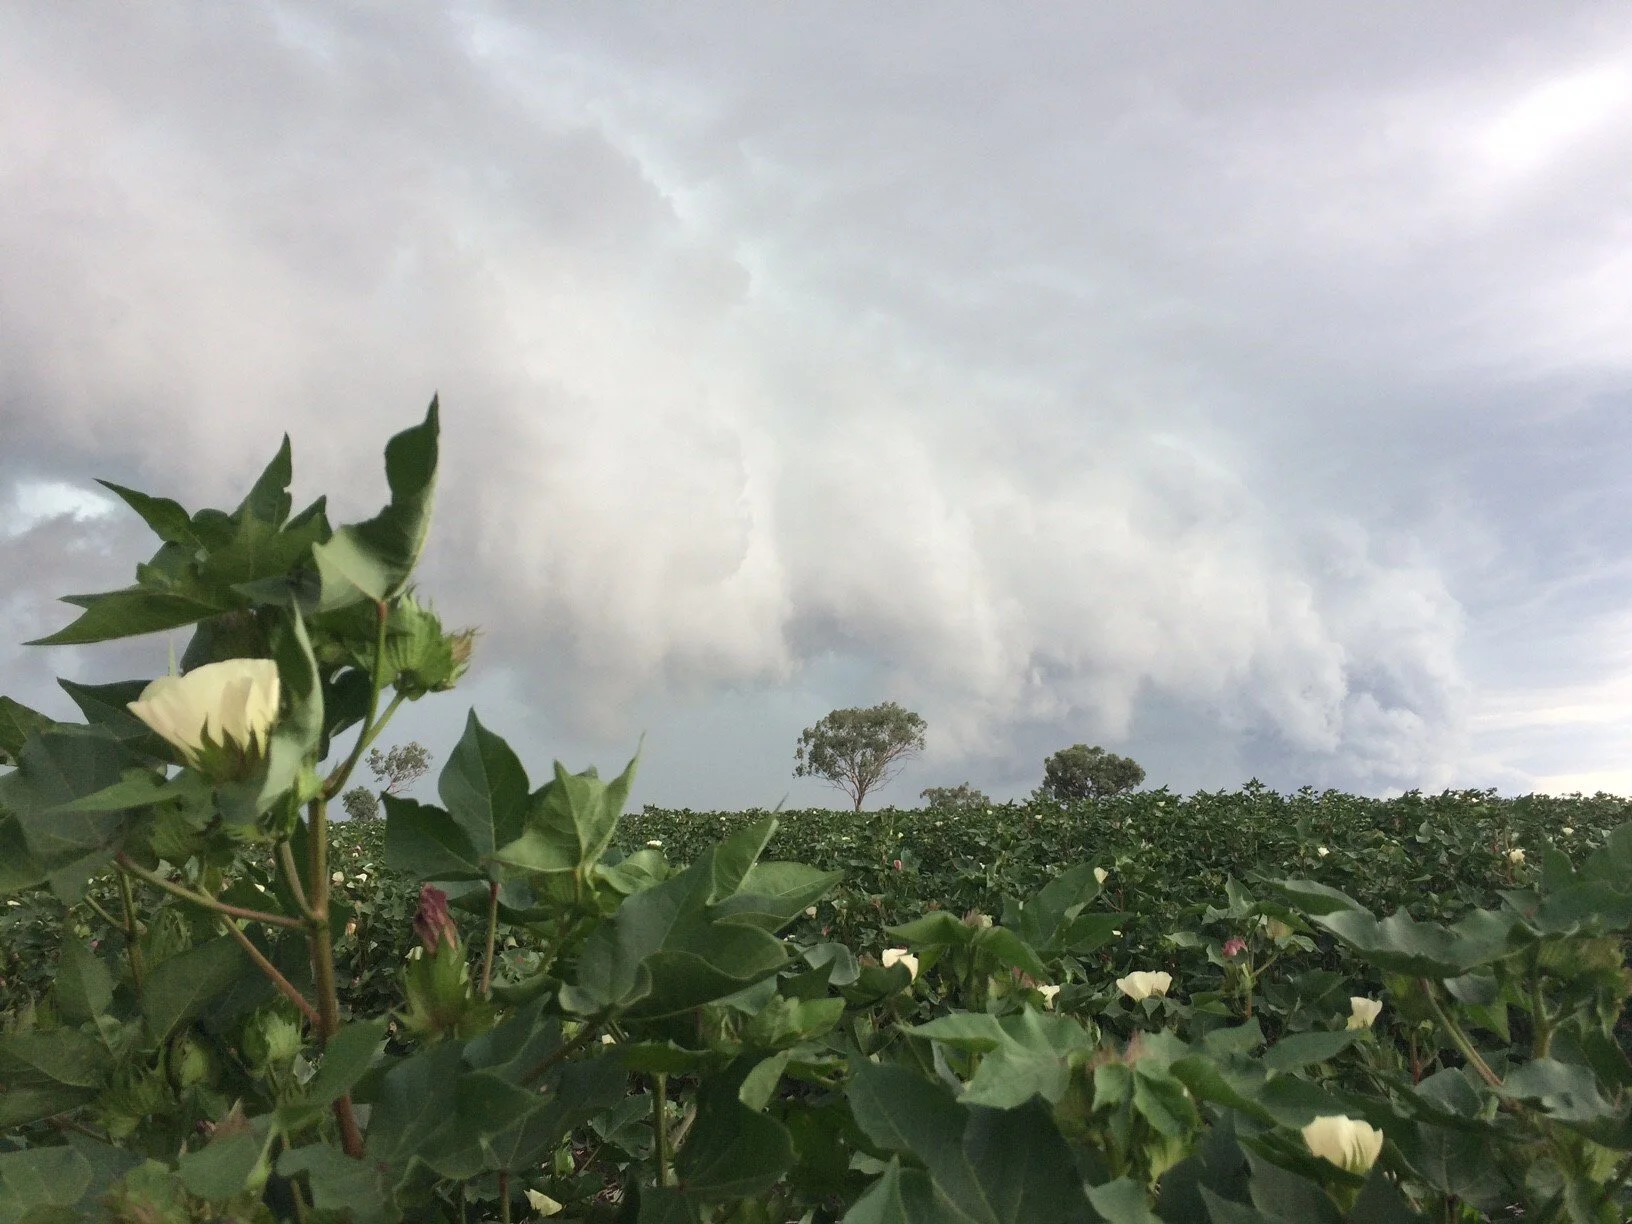
A storm brewing over the 2020-21 cotton crop
Your region was recently affected by severe flooding from a weather event that was more extreme than forecast, do you think that the extremes of droughts & flooding rains are changing the way those in rural businesses consider climate?
The 2018/19 drought saw everyone in our region having to tighten their belts, and by Christmas 2019 mentally prepare that it was going to keep going for some time to come. But then we had to go from zero to a hundred miles an hour in a matter of weeks in early 2020, and 2021 has so far been more of the same. So in our game you can plan all you like for a set of conditions, but you have to be ready to pivot quickly and sometimes dramatically. Each season we have to assume we could be facing extremes either way, and we aim to mitigate that by leveraging relationships and information sources available as much as possible to prepare for very different outcomes. I’m not sure that even the extreme events of the last few years have greatly changed the way we all consider climate, but I do feel we are getting better as using resources available to adapt to what’s ahead.

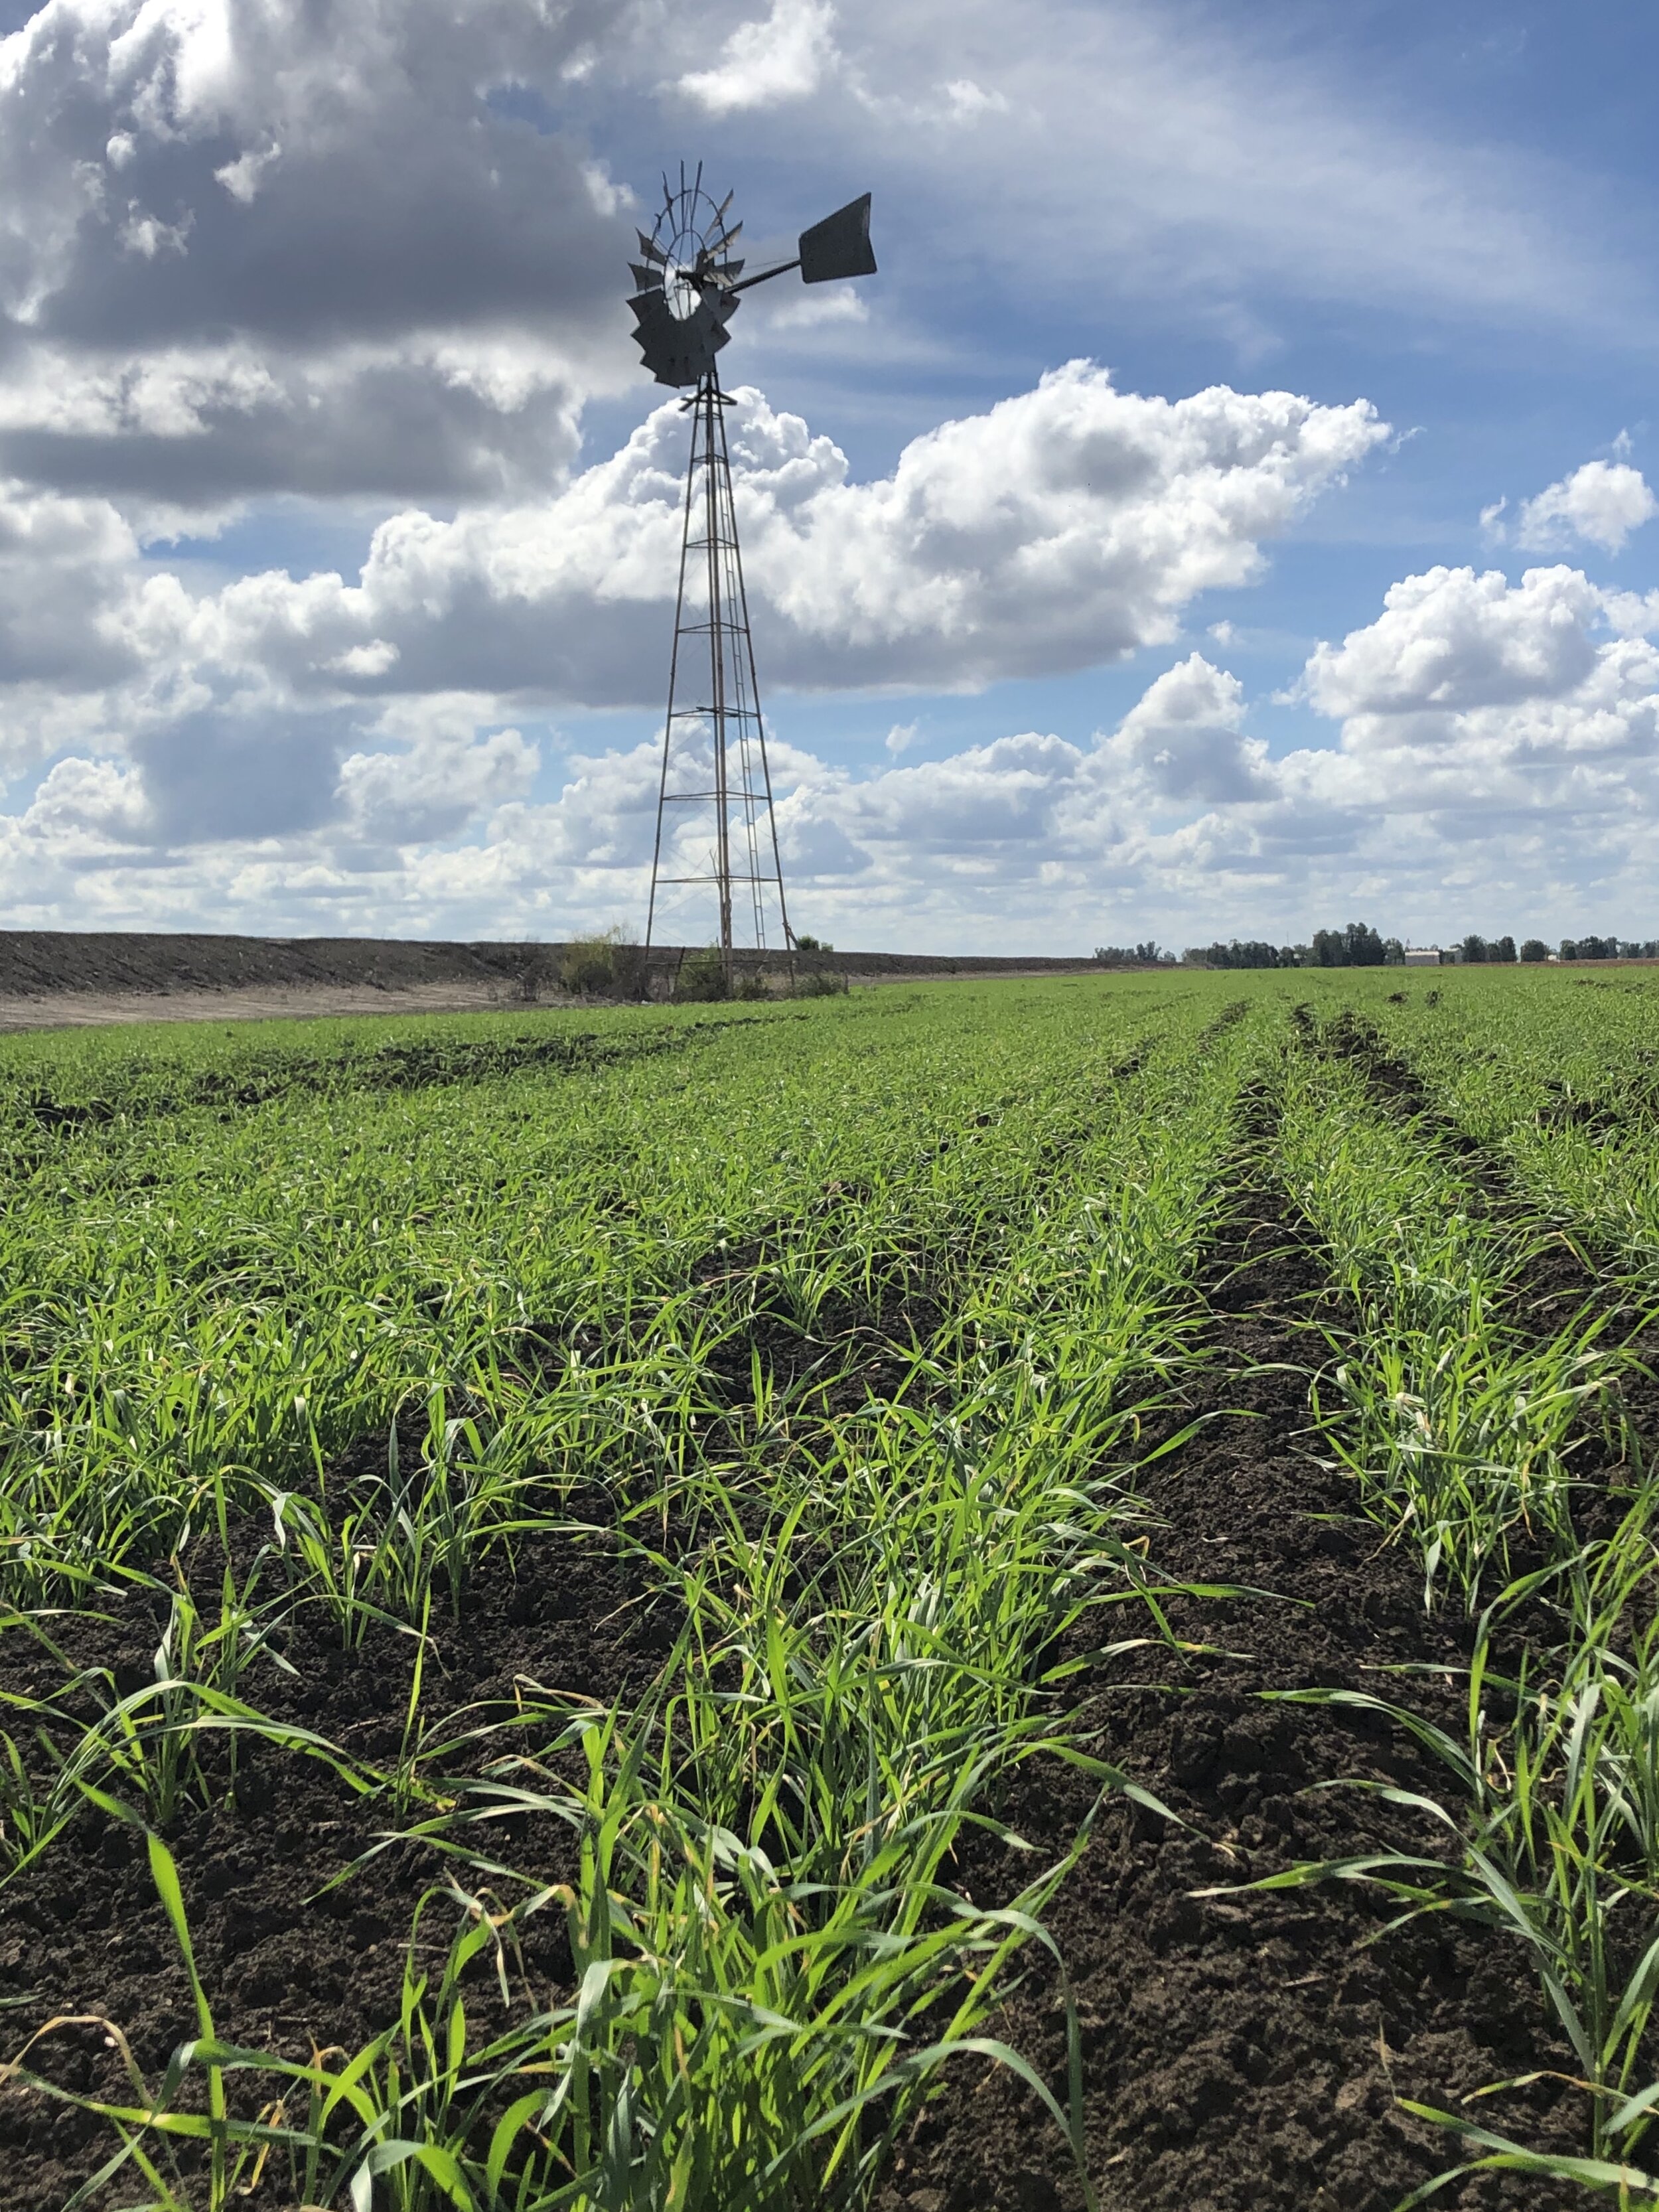
IF 2020 winter started with a full profile, 2021 is overflowing!
While weather and seasonal climate outlooks are a major influence in yours and your clients businesses, do the underlying climate drivers often come up in client conversation? While weather and seasonal climate outlooks are a major influence in yours and your clients businesses, do the underlying climate drivers often come up in client conversation?
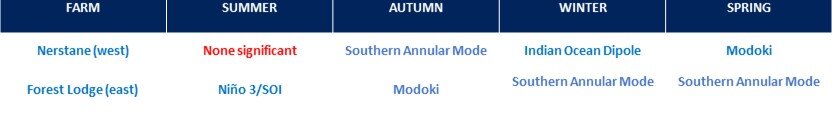
It can be a little like religion sometimes, as everyone can have their own sources that they follow! The drivers do come up often in conversation, but the variety of models available overlaid with broad generalisations from the media mean that there can be broad interpretations. We’ve been aiming to gradually improve climate literacy amongst our staff and customers with the help of the AgEcon team, and 2019 certainly raised awareness of the major drivers that can have an effect on our weather as we all started to watch systems such as the SAM and IOD that previously probably weren’t quite so widely understood.

Any other comments on considering climate in rural businesses?
Climate dominates everything we do, but I’m constantly amazed at how farming in Australia keeps getting better at doing more with less. There’s plenty of doom and gloom in the media about what the future holds, but I’m optimistic that we’ll keep adapting.
Like stats? Checkout www.climateapp.net.au